Governance
Nonprofit Boards
Strong nonprofit boards are integral to the sustainability and continued growth of the organization, but finding the right mix of members isn’t always easy. Forty-four percent of organizations report that attracting quality leadership and board members is a high or moderate level challenge.

Board Practices
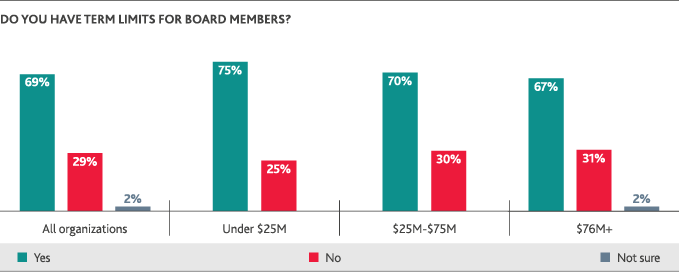
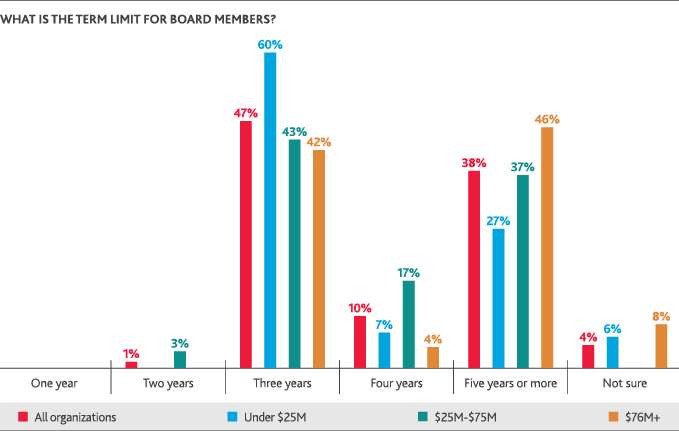
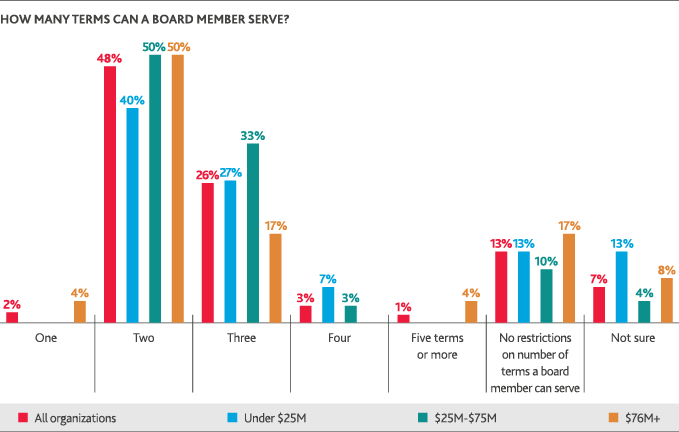
Board Size
Nearly half of nonprofits (45 percent) have more than 20 board members.
This is the most common board size across all revenue levels.

Sixteen percent of all organizations have between 16 to 20 board members.
Board Committees
A majority of organizations across all revenue levels have nominating, investment, executive, and audit and finance board committees. Upper-midrange and large organizations more commonly have compensation committees on their boards: 60 percent and 67 percent, respectively. Just 40 percent of midrange nonprofits have an established compensation committee.
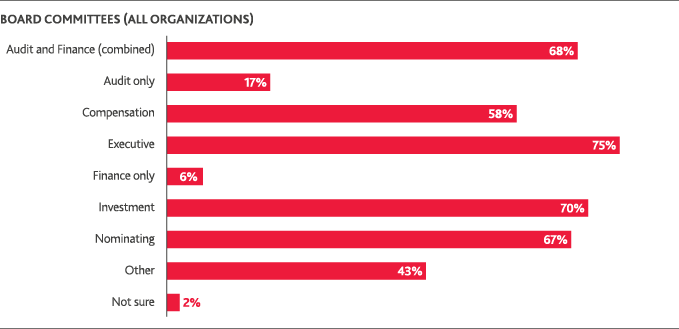
Many organizations (43 percent) have committees beyond the categories listed. Other committees include: M&A, human resources, marketing, education, program-related investments development, public relations, real estate, community and donor relations, quality and outcomes, grants, and strategic planning.
Board Challenges
Among all nonprofit organizations, the top challenges for nonprofit boards are internal resource constraints (cited as a high or moderate challenge by 61 percent of respondents), succession planning (58 percent), cybersecurity (54 percent), changing technology (48 percent), and loss or decline of a major revenue stream (47 percent).
Governance Practices
TO WHICH OF THE FOLLOWING DO YOU DISTRIBUTE AN ANNUAL CONFLICT OF INTEREST STATEMENT?

WHOW IS THE FINAL ARBITER OF A CONFLICT OF INTEREST?

Policies for Board Reviews of Executive Director Compensation and Performance
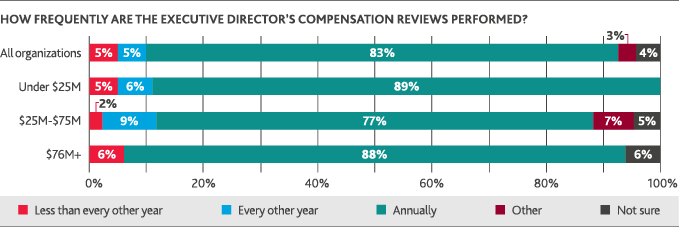
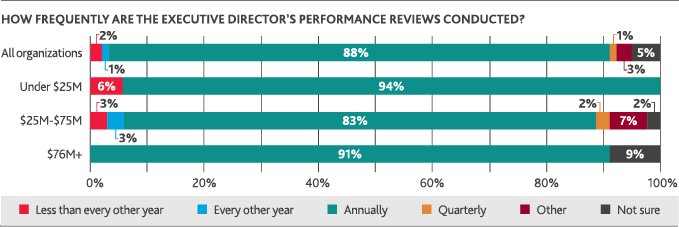
Nearly all nonprofits (94 percent) require independent board members to evaluate the Executive Director’s compensation and performance. These reviews are most commonly conducted on an annual basis.
Fraud Risk Management
Identified as a high- or moderate-level challenge for nonprofit boards by just 15 percent of respondents, fraud risk management is nonetheless a necessary and important charge. Many organizations may not believe they’re at risk, but in reality, nonprofits are often victims of fraudulent activities.
A 2017 Institute of Management Accountants survey found that nearly 1 in 5 nonprofits (19 percent) report some type of fraud from 2012 to 2017.
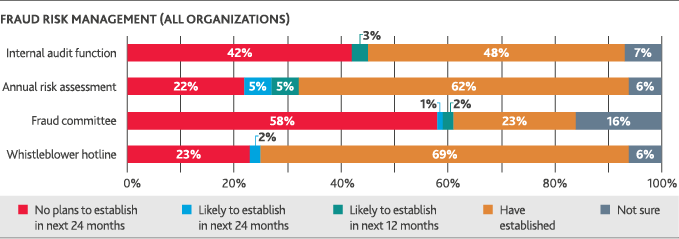
Nonprofits take varied approaches to combating fraud. About 7 in 10 nonprofits (69 percent) have a whistleblower hotline in place—the most common method of fraud risk management. Among midrange organizations, that number drops: Only 35 percent have established a whistleblower hotline.
The other leading fraud risk management efforts are annual risk assessments (62 percent), internal audit functions (48 percent), and fraud committees (23 percent).
Audit Firm and Audit Partner Rotation
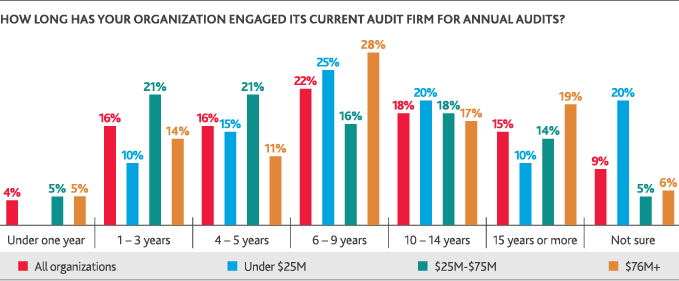
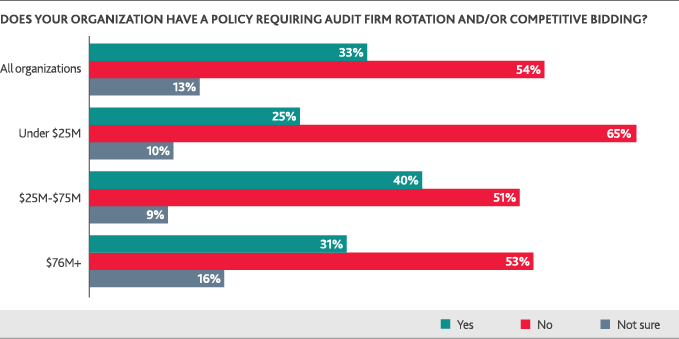
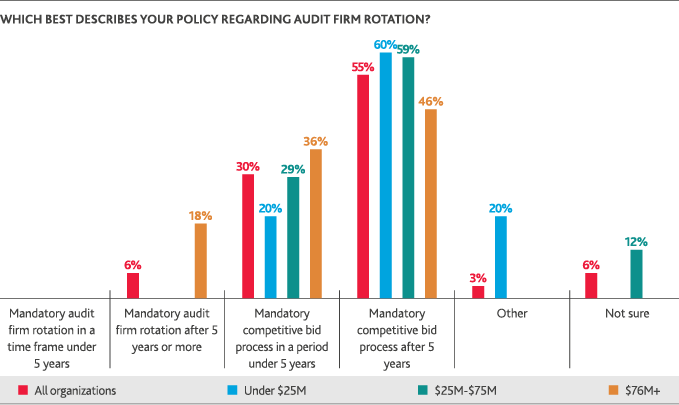
Nonprofits have engaged their current audit firms for an average of 8.5 years, a tenure that is relatively consistent across revenue groups. Fifteen percent have engaged the same audit firm for 15 years or more. While not all respondents were familiar with their organizations’ policies around audit firm rotation, about one-third (33 percent) do have a formal policy in place. Across all revenue groups, the most common policy is a mandatory competitive bid process after a period of five years or more—a practice maintained by 55 percent of nonprofits.
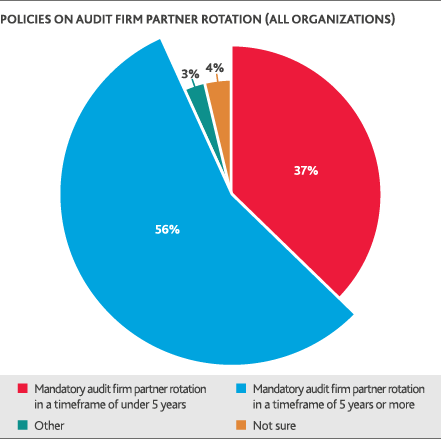
Less than one-third (27 percent) of nonprofits have a policy on audit firm partner rotation. Among those respondents, a mandatory audit firm partner rotation after five years is the most common policy.
SHARE