BDO Manufacturing CFO Outlook Survey
This survey was conducted in Fall 2019, prior to the global COVID-19 pandemic. We know that every organization—including BDO—is focused on the well-being of families, colleagues, and our communities. The middle market has proven its resilience in times of turbulence, and we believe, with a conscientious business mindset, organizations will manage the situation effectively. For information on how to secure your business in the wake of COVID-19, please visit www.bdo.com/COVID-19.
Manufacturing Growth in a Connected Economy
Table of Contents
- The 2020 Growth Playbook
- Bracing for Impact
- Policy Matters
- The Manufacturing CFO Playbook for 2020
- Survey Demographics
The manufacturing industry has long been recognized as the heartbeat of the American economy. Historically, its health has served as a pulse check for broader economic activity.
The modern reality is not so straightforward. Though manufacturing output today is higher than it was in the year 2000, it represents a smaller—and shrinking—percentage of overall U.S. employment, at just 8.5%. Trade in services is outpacing trade in goods, and the emerging category of digital goods and services is growing even faster.
In an increasingly diversified economy, the manufacturing sector is a bellwether—not necessarily the bellwether—for overall economic health.
As the digital economy matures, the vital signs we once used to measure the health of the manufacturing sector may no longer be the most relevant. Productivity, for example, can no longer be measured by the size of the workforce. Similarly, manufacturing output doesn’t reflect changes to gross margins.
That does not mean these indicators are entirely without merit, or that manufacturers are any less sensitive to shifts in global demand. As we head into the 11th year of the longest bull market on record, worrying signs indicate some softness in manufacturing. 2019 saw factory activity fall to its lowest levels since 2009, buffeted by trade wars, a contraction in business investment and economic uncertainty.
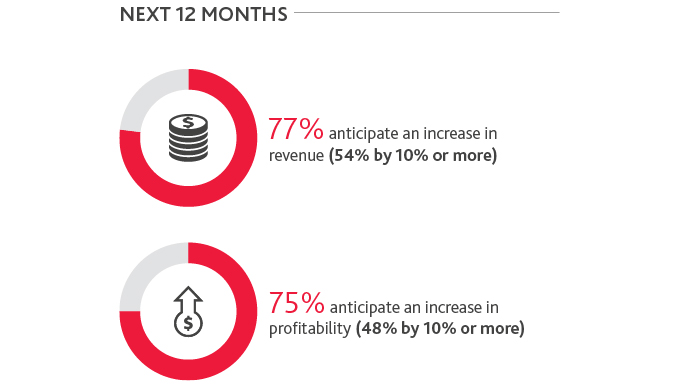
But fears of an industrial slump may be overblown—at least within the middle market. While middle market manufacturing CFOs are leery of a downturn, they remain optimistic about their growth prospects for the year ahead, according to BDO’s inaugural 2020 Manufacturing CFO Outlook Survey. And with just a fifth (20%) of respondents anticipating a recession in 2020, most are still in investment mode.
The nature of those investments, however, point to an indisputable fact: the manufacturing industry of tomorrow will be fundamentally different than that of yesterday. Manufacturers may be bracing for trade turbulence and weakening global demand, but it’s the larger tectonic shifts at play forcing their hands.
“The manufacturing industry is the heart and soul of America—its creators, builders and makers. The digitization of business does not diminish manufacturing’s role as an engine of economic growth and industrial innovation, but it does reshape it. Manufacturers can’t afford to let a temporary slowdown distract them from the bigger picture. Recession is a phase, but disruption isn’t going away.”
 |
ESKANDER YAVAR |
The 2020 Growth Playbook
Investing in Industry 4.0
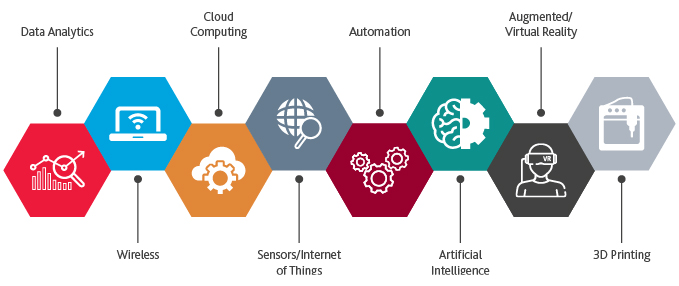
The natural turns of the economy must be viewed in parallel with the massive industry disruption that is, for manufacturers, both existential threat and unprecedented opportunity. After a relatively sluggish period of growth in productivity over the last few decades, the convergence of multiple technologies, from cloud computing to the Internet of Things to artificial intelligence and extended reality, is ushering in a new era of productivity and reinvention—the fourth Industrial revolution, or Industry 4.0. This still-nascent paradigm shift is unfolding in real time and will continue to take root regardless of where we are in the economic cycle.
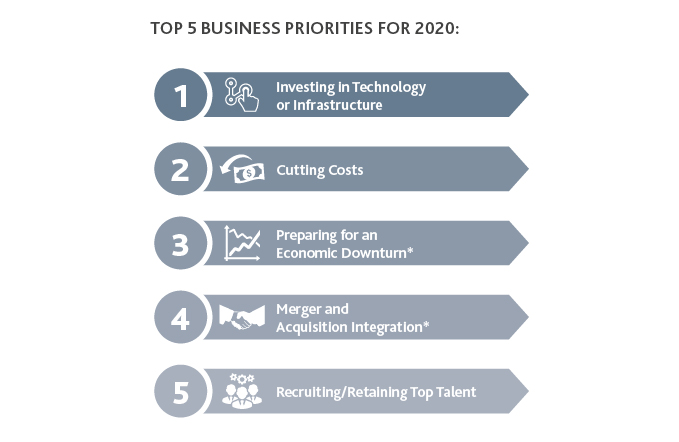
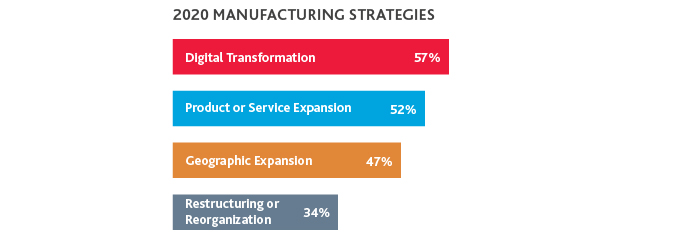
The majority of middle market manufacturers have taken note and, more importantly, are taking action: More than half (57%) of survey respondents are pursuing digital transformation in 2020. Manufacturing CFOs also cited investing in technology or infrastructure as their top business priority for 2020, ahead of cutting costs.

Part and parcel with digital transformation, many manufacturers will be focused on driving top-line growth in 2020 by introducing new products or services. Yes, services—in an Industry 4.0 world, manufacturers are able to leverage their products as platforms for service delivery or convert their products into service offerings (and recurring sources of revenue).
Talent Wars
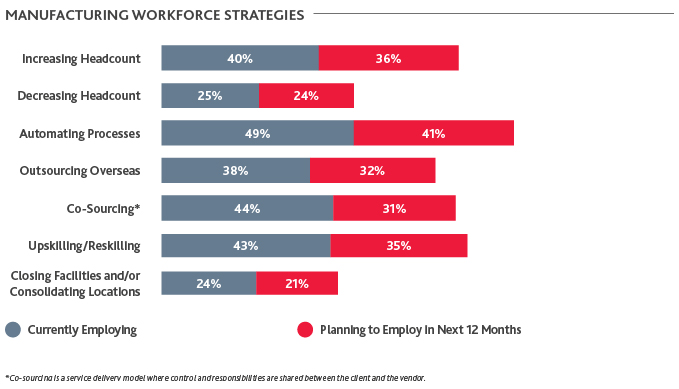
Despite apocalyptic predictions about robots taking over manufacturing jobs, the jobs are there—the necessary skills and responsibilities are just changing. Even though 90% of manufacturers are either currently automating processes or planning to automate them in the next 12 months, 76% are also increasing headcount.
Each organization must determine what resourcing strategies work best for them on a case-by-case basis, but the process will be similar:
|
Assess the current staffing landscape |
|
|
Identify needs for business goals |
|
|
Create a staffing projection |
|
|
Maintain a strong workplace culture |
Because automation and AI will take over certain tasks, alternative staffing models make sense in a wide range of cases. These allow manufacturers to maintain an agile workforce that can complete the tasks of current workflow without adding future obligations for the business.
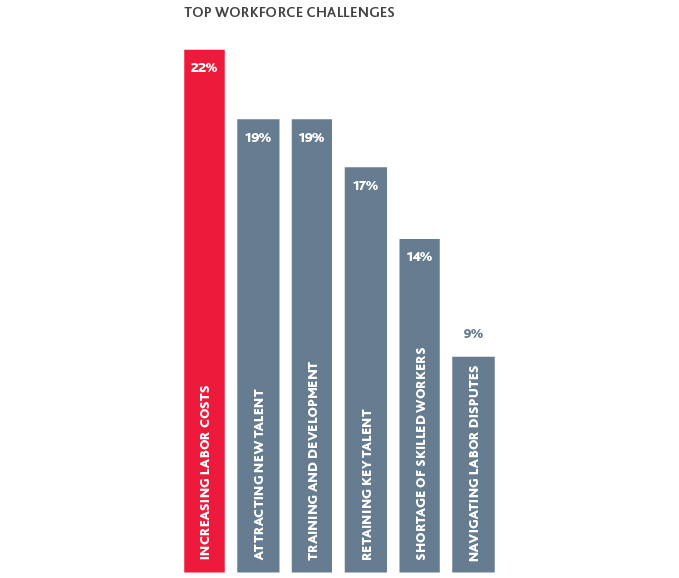
Industry 4.0 demands more engineers, as well as a skilled workforce, to operate a new breed of machines and equipment. But competition for the limited pool of engineering talent is at an all-time high. The U.S. labor market is near full employment, and the unemployment rate for many highly coveted roles, particularly STEM roles like mechanical engineers, data scientists and software developers, is 2% or lower. The battle for talent is thus fought on employees’ terms—and as a result, labor costs are rising across every industry. Manufacturing is no exception.
The industry also needs to proactively combat the perception that manufacturing is a dead-end job. To attract and retain next-gen talent, manufacturers will need to offer competitive salaries and enhanced benefits, such as remote working arrangements and flexible scheduling, tailored health and wellness programs, as well as extended maternity and paternity leave. Minimizing costly labor turnover and selecting staff with the right core capabilities will remain among the most important considerations for manufacturers in 2020.
Financing Growth
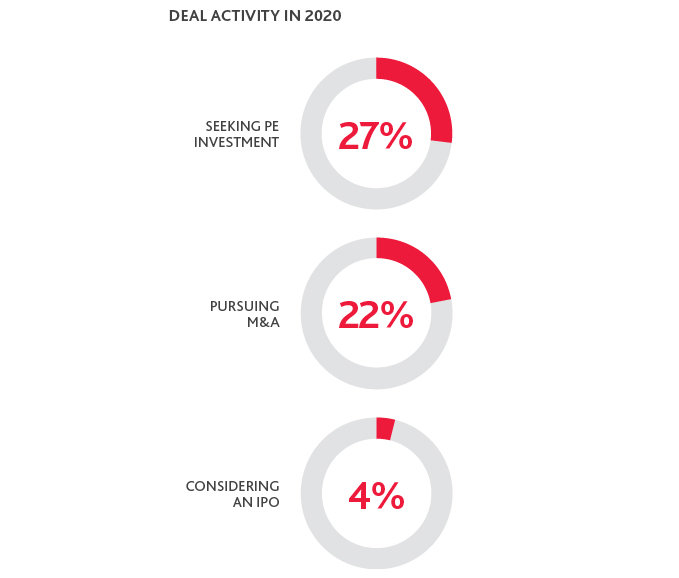
For manufacturers seeking an injection of capital or looking to buy rather than build to fill other strategic needs, ongoing trade frictions and concerns of an industry slump are complicating an otherwise fertile deal environment. Rising and unpredictable input costs is indeed starting to temper activity: Industrial manufacturing deal value and volume both decreased year-over-year through Q3 2019. Looking forward, just over a fifth (22%) of manufacturing CFOs plan on pursuing M&A in the next year.
Each deal also brings a degree of risk, so it’s important to examine key strategies for integration. Manufacturers that engaged in deals in 2019 are fully immersed in the complex work of integration, and they are looking to 2020 with an eye toward realizing value. Buyers must focus on their deal rationale and plan to capture value quickly, while also carefully shaping the new organization for long-term success.
A greater portion of respondents are seeking private equity investment, but PE interest in the sector may wane in 2020 because of the unpredictability of future cash flows. The struggles of 2019’s IPO class across the board has made pursuing an initial offering a largely unappealing option.
Bracing for Impact
Preparing for a Change in Economic Fortune
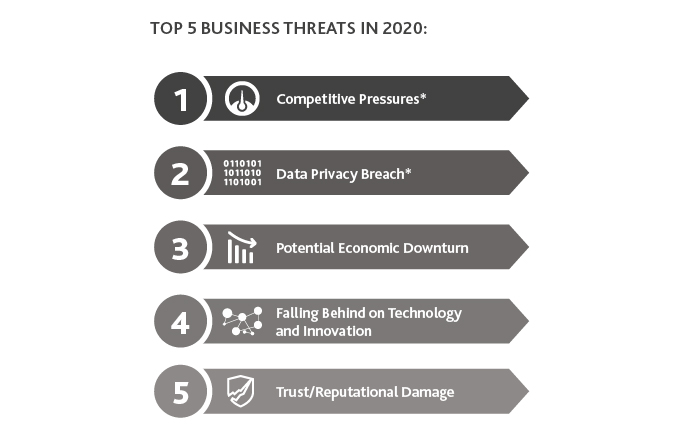
Recession fears ebbed and flowed throughout 2019, fomenting a pervasive environment of uncertainty. The last recession hit manufacturers hard, and the automaker bailout is still an open wound, even 10-plus years later. Manufacturers are nervous, and for good reason: The cyclicality of the manufacturing industry combined with underlying disruptive market forces indicates the next downturn will have an outsized impact. A greater percentage (32%) of manufacturing CFOs cite a potential economic downturn as their top geopolitical concern than the percentage citing international trade tensions (18%).
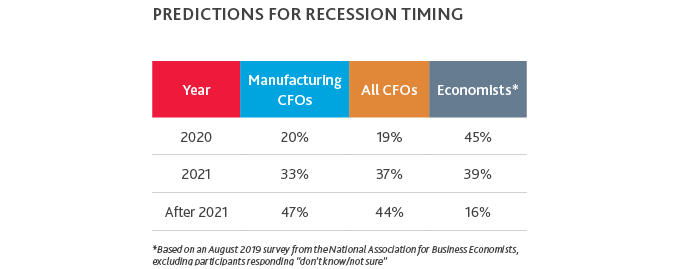
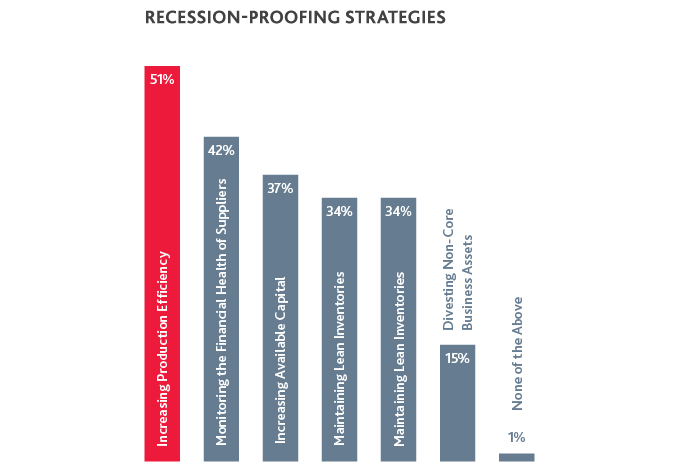
Whether the next recession comes tomorrow or in two or more years, middle market manufacturers are proactively taking steps to shore up their business for potential
economic headwinds.
What no one can predict is the next downturn’s duration and severity. A bear market does not a financial crisis make—and without a major shock to the system, it’s possible the next recession will be shallow and short-lived.
Trade Turbulence
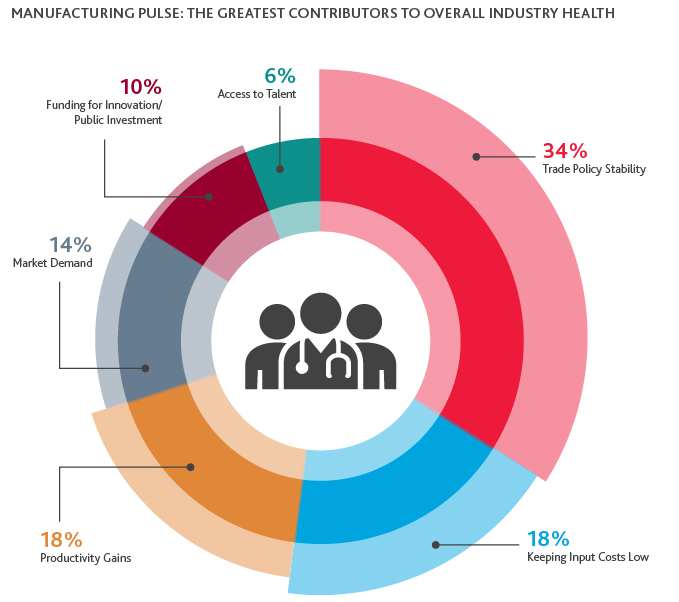
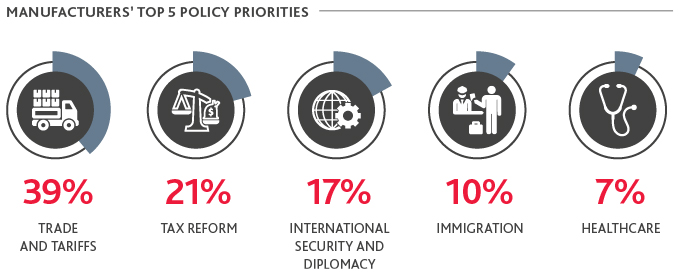
While the prospect of recession may be scarier than additional tariffs, the constant trade tumult of the last two years weighs heavily on the minds of manufacturing CFOs. Survey respondents cite trade policy stability as the most critical factor to the overall health of the U.S. manufacturing industry.
As the world first learned in 2018, President Trump’s tough trade rhetoric is more than bluster. U.S. trade policy has continued to plague manufacturing CFOs as disputes rage on between the U.S. and its major trading partners. The will-they-or-won’t-they of ongoing negotiations is unlikely to abate in 2020.
Since the start of the trade war, the United States has imposed tariffs on more than $375 billion worth of imports from China. Another wave of tariffs on $7.5 billion worth of European Union goods went into effect in October 2019, targeting cheese, wine, whiskey and aircraft products, among other goods.
Tariffs on EU auto imports are currently under consideration. Even Mexico was temporarily subjected to a 17.5% tariff on tomato imports before a deal was struck. But tariffs are only one tool in the Trump administration’s trade arsenal: Over the last three years, the administration added more than 3,100 individuals and entities to the Treasury Department’s sanctions list. Other foreign-made goods have been subject to export controls.
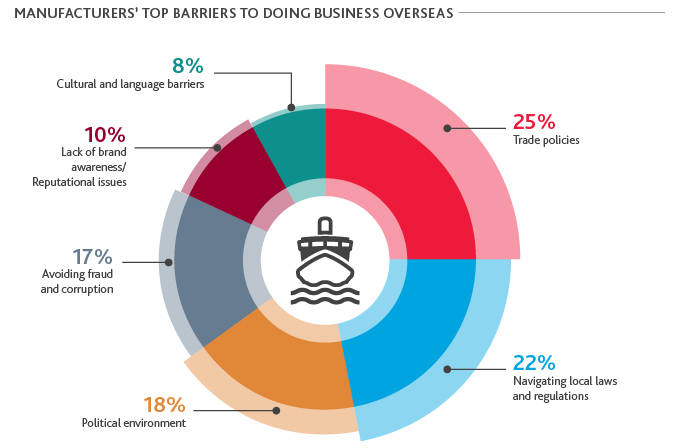
While the intention of these “America First” trade policies is to “level the playing field” for American manufacturers, the industry itself is largely opposed to the protectionist measures that have actually been implemented. Unhindered global trade ultimately benefits manufacturers, who have long supported policy agendas that break down trade barriers rather than build them.
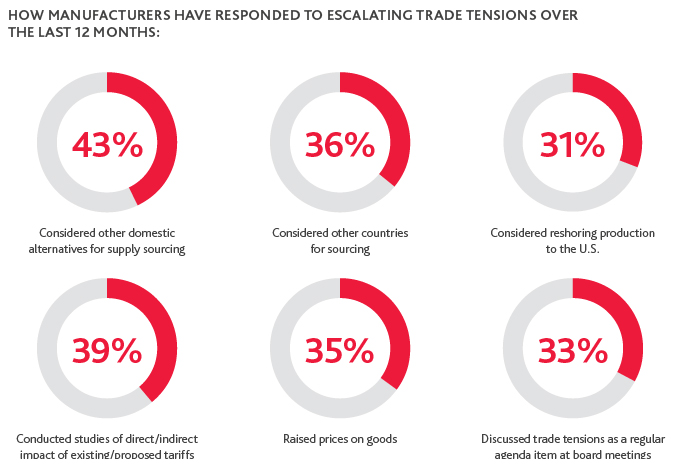
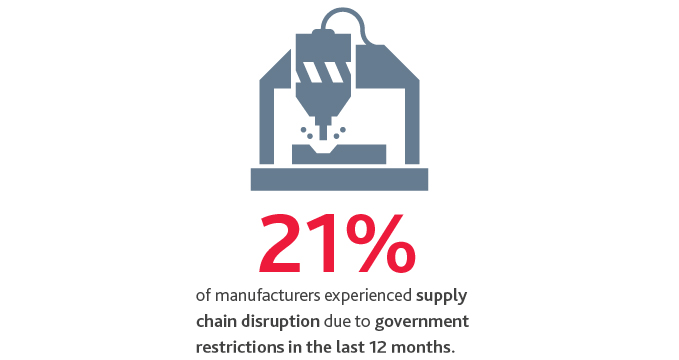
Many U.S. manufacturers rely on more affordable imports from overseas to make their products. The imposition of tariffs and sanctions has resulted in significant supply chain disruptions. In fact, more than one-in-five (21%) manufacturers experienced a disruption to their supply chain as a result of government restrictions in the last 12 months.

China is also the third-largest—and fastest growing—market for U.S. goods exports. For its part, China has imposed $110 billion of retaliatory tariffs on U.S. exports. Escalating trade tensions between the two nations have had a marked negative impact on growth in exports to China, both in terms of volume and value.
“When virtually every import from China is subject to a 25% safeguard duty, knowing the rules of tariff classification and requesting exemptions where possible is critical to keeping supply chain costs low. The impact can also be mitigated if new vendors can be located or manufacturing operations can be re-tooled in other countries.”
 |
DAMON V. PIKE |
Optimizing the Supply Chain
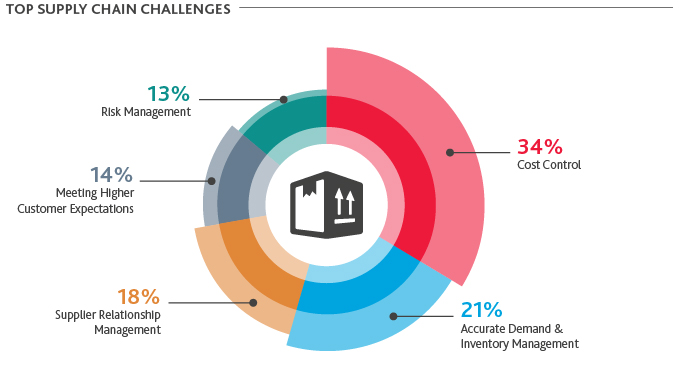
The trade war with China and other major trading partners has certainly been an impetus for executives to rethink their global supply chains. However, rising labor costs, political instability and a greater focus on transparency, among other trends, mean supply chains will be under review regardless of the outcome of trade negotiations. While cost control is the predominant consideration and challenge in optimizing the supply chain, other factors, such as speed, resilience and quality control, also come into play.
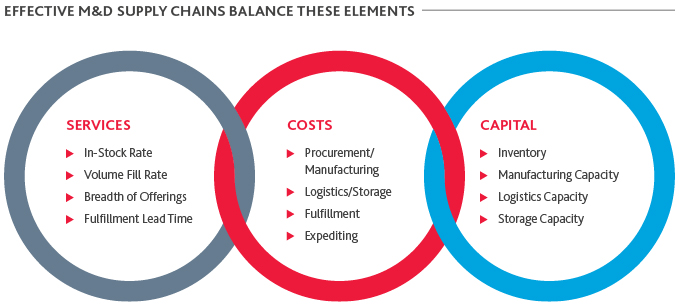
Strategic sourcing is one lever manufacturers can pull to reduce procurement costs and mitigate tax and tariff impacts—though it’s worth noting that roughly a third (33%) of manufacturers still view Asia as the most stable location outside the U.S. for sourcing products in the long-term.
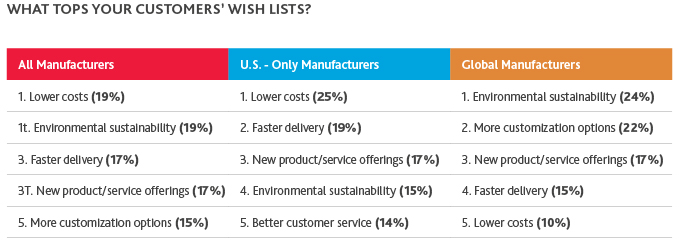
Manufacturers also need to realign their supply chain strategies to account for shifts in customer demand as well as demographics. When facing off against larger competitors who provide next-day or even same-day delivery, supply chain efficiency may need to take precedence over cutting costs. Manufacturers with global operations, for example, see greater customer demand for faster delivery than they do lower costs.
“The imposition of tariffs has prompted many manufacturers to review their supplier relationships and materials acquisition strategy from a risk mitigation perspective. While trade policy is just one external business driver of many, it is precipitating a broader shift in supply chain management from reactive to proactive so that disruptions won’t derail efficiency or significantly drive up costs.”
 |
JEFFREY PRATT |
Supply Chain Management: Tax Blind Spots
As manufacturers evaluate changes to their supply chain operations, they will need to assess potential exit charges, permanent establishment status and the preservation of tax attributes on the movement of functions, assets and risks, including:
-
Goods crossing national boundaries require customs classifications, and goods with technical content can be particularly challenging to define. Any shifts in the flow of goods and sales overseas should prompt a new look at indirect and VAT tax exposures.
-
Manufacturers expanding supply chain operations domestically or reducing their domestic footprint must also consider the implications on state nexus.
-
Corporate manufacturers that sell or lease property to foreign customers or provide services overseas should consider whether such activities will qualify for the Foreign-Derived Intangible Income (FDII) deduction, which can reduce their effective tax rate on eligible income by almost 8%.
Policy Matters
Taxing Taxation
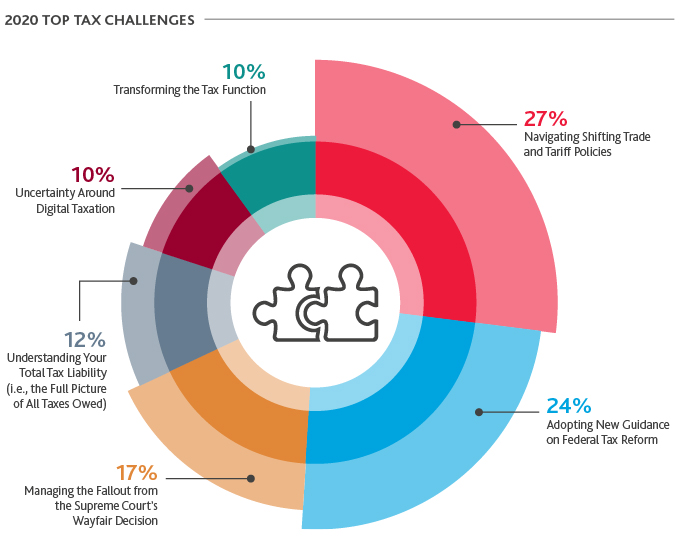
Given the disproportionate effect on the manufacturing industry, it comes as no surprise that survey respondents rank navigating shifting trade and tariff policies as the most challenging tax issue they will face in the year ahead. Less intuitive is the continued impact of the Tax Cuts and Jobs Act of 2017 (TCJA). Though the TCJA has been in effect for more than two years, the IRS is still issuing additional guidance, leaving significant room for statutory interpretation. Some manufacturers are taking a wait-and-see approach to those provisions that require further clarification. Others are more aggressively pursuing tax minimization strategies they believe to be legally defensible, but have yet to be proven out in court.
Though perhaps most surprising is the relative importance manufacturing CFOs place on managing the fallout from the Supreme Court’s Wayfair Decision, which asserts physical presence is not required for a state to impose sales tax nexus on a remote seller. Although a sales and use tax exemption is available to manufacturers in most states, respondents appear to be feeling the pain associated with obtaining resale exemption certificates from customers located in states where manufacturers have no in-state presence.
“Between the TCJA’s ongoing ripple effects, trade dynamics and evolving approaches to digital taxation both here in the U.S. and abroad, the tax environment is more complex than it has ever been before. Manufacturers operating in today’s connected economy must embrace a total tax liability mindset—not only a continuous calculation of all taxes owed, but an understanding of how tax strategy intersects with broader business goals.”
|
|
JOHN MARQUARDT |
All Eyes on Election 2020
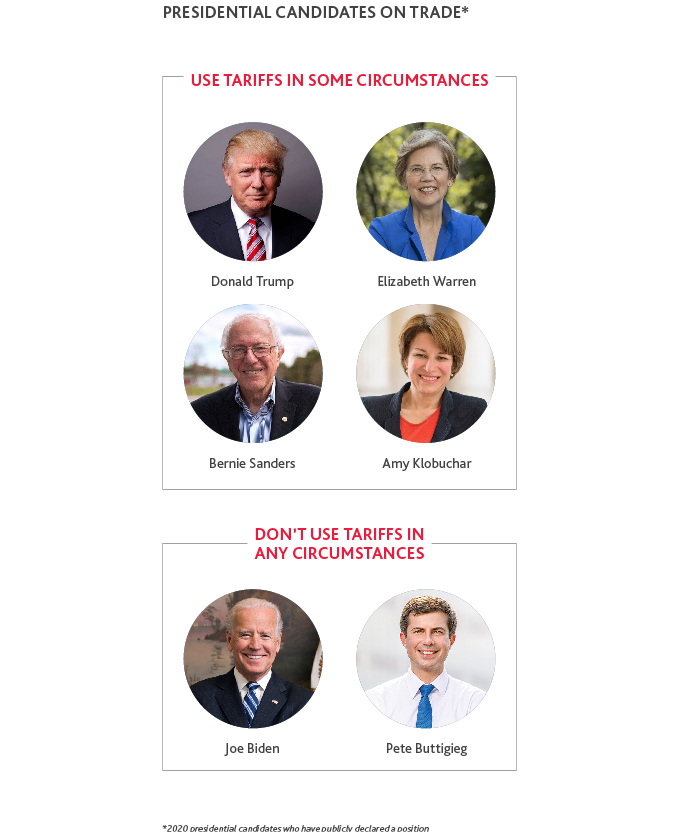
With the 2020 Iowa caucuses around the corner, manufacturers are closely following candidates’ positions on the policy issues that will define the industry’s long-term health and economic growth. As employers of more than 12 million Americans, manufacturers are uniquely positioned to advocate for policies and initiatives that will spur economic development and fuel progress.
No matter who wins in November, change is on the horizon—but it isn’t going to be immediate. During the election cycle—and particularly during presidential election cycles—it is all too easy to get caught up in policy proposals and campaign rhetoric. But the fact is policy change is a complex and slow-moving process requiring compromise on the part of both the President and Congress, meaning whatever a candidate proposes now is unlikely to look much like what might eventually be signed into law.
The Manufacturing CFO Playbook for 2020
What does 2020 have in store for manufacturers? More trade talk, more competition, more costs—and if some projections are correct, a global economic slump.
It’s the uncertainty that poses the greatest risk to U.S. manufacturing organizations. Uncertainty can cause decision paralysis, resulting in a pullback in spending that becomes a self-fulfilling prophecy: less innovation, less demand, and ultimately, less growth. Manufacturing CFOs may want to improve financial discipline, build up cash reserves and continue cutting costs. However, manufacturers need to be more aggressive during the pre-recession period, capitalizing on market opportunities before they dry up, driving new efficiencies and taking advantage of new technologies to do so. The goal can’t be to just survive demanding economic conditions, but to come out the other side ahead of competitors, positioned for accelerated growth.
Manufacturers’ next big moves will depend on their current financial state and competitive positioning, but one thing is clear: Industry 4.0 is rewriting the rules of the game. Whether the economy does or does not tip into recession, manufacturers can’t afford to lose sight of the long-term picture: a connected world that requires a connected manufacturing blueprint.
Learn more about how BDO helps middle market manufacturers not just survive but thrive in a connected world.
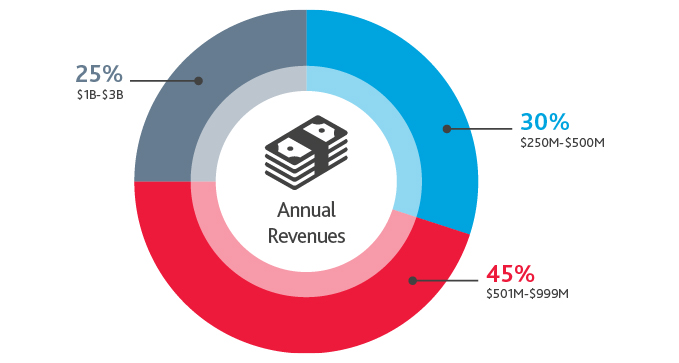
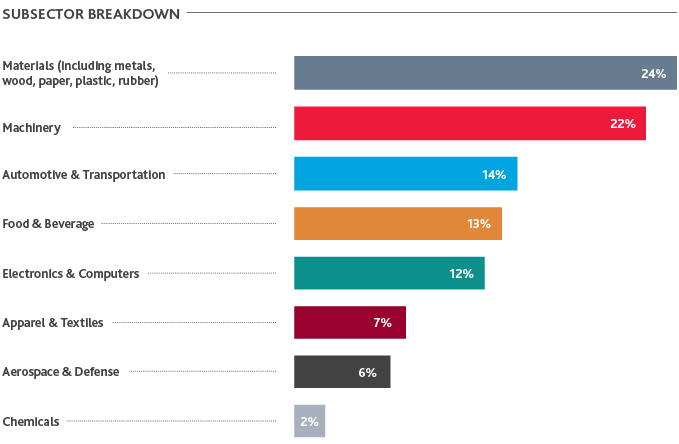
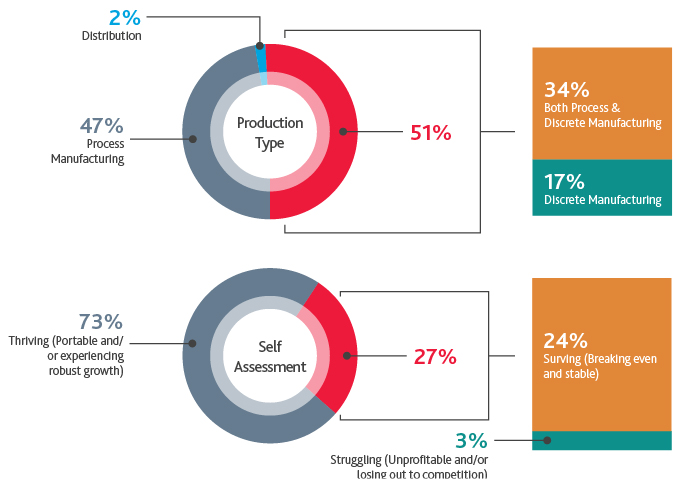
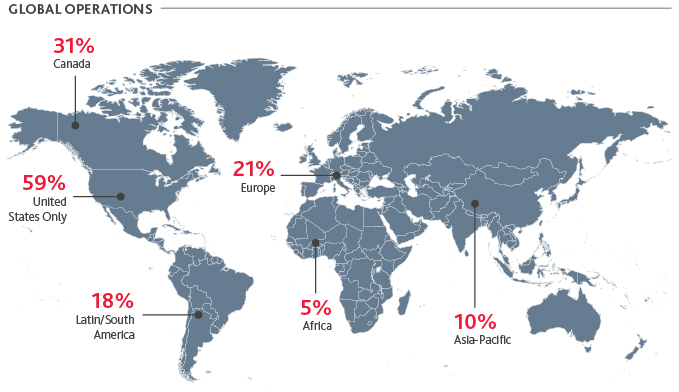
Survey Demographics


SHARE